
Preliminary Economic Assessment
On July 16, 2026, the Company released updated Preliminary Economic Assessment (“PEA”) results for the Carangas Project in Oruro Department, Bolivia (the “Project”). The Updated Carangas PEA Technical Report considers an increased throughput rate and the inclusion of the gold zone when compared to the previous Preliminary Economic Assessment technical report for the dated September 5, 2024.
The Updated Carangas PEA is prepared in accordance with National Instrument 43-101 – Standards of Disclosure for Mineral Projects (“NI 43-101”) by Ausenco Engineering Canada ULC (“Ausenco”) dated effective July 16, 2026.
Results shown here are from the Updated Carangas PEA Technical Report, with an effective date of July 16, 2026 . The PEA is preliminary in nature and is intended to provide an initial assessment of the Carangas’s economic potential and development options. The mine schedule and economic assessment included in the report contain numerous assumptions and are based on both Indicated and Inferred Mineral Resources. Inferred Mineral Resources are considered too speculative geologically to have the economic considerations applied to them that would enable them to be categorized as Mineral Reserves, and there is no certainty that the preliminary economic assessment described therein will be achieved or that the Updated Carangas PEA Technical Report results will be realized.
Updated Carangas PEA Highlights ($ figures in USD):
- Post-tax net present value (“NPV”) (5%) of $2.65 billion and internal rate of return (“IRR”) of 35.9% at base case metal prices of: $45.00/ounce (“oz”) silver (“Ag”), $3,400/oz gold (“Au”), $1.20/pound (“lb”) zinc (“Zn”), and $0.90/lb lead (“Pb”);
- Post tax NPV and IRR of $4.16 billion and 51.5%, respectively, at $67.50/oz Ag and the other metal prices held constant;
- Post tax NPV and IRR of $3.23 billion and 37.0%, respectively, at $5,100/oz Au and the other metal prices held constant;
- 19-year life of mine (“LOM”), excluding two-years of pre-production, producing approximately 195 million oz (“Moz”) of payable Ag, 1.1 Moz of payable Au, 1,453 million pounds (“Mlbs”) of payable Zn and 941 Mlbs of payable Pb, or 339.0 Moz silver equivalent (“AgEq” )1;
- Mining will occur during years 1 through 16. For years 17 to 19 all production will come from stockpiles;
- Payable silver production of approximately 15.5 Moz per year (18.9 Moz AgEq per year) in years 1 through 8, the “pre-gold production period”; average all-in sustaining cost (“AISC”) of $18.25/oz AgEq, or average AISC of $12.11/oz Ag, net of by-products, during the pre-gold production period;
- Payable silver production of approximately 7.6 Moz per year and payable gold production of approximately 142.7 thousand ounces (“koz”) per year (20.7 Moz AgEq per year) from years 9 through 16, the “gold production period”; average AISC of $17.78/oz AgEq, or average AISC of $-39.49/oz Ag, net of by-products, during the gold production period;
- Payable silver production of 10.3 Moz total (21.6 Moz AgEq total) for years 17 to 19, the “stockpile period”; and
- Average LOM AISC of $19.16/oz AgEq, or average LOM AISC of $0.11/oz Ag, net of by-products.
- Initial capital costs of $644.5 million and a post-tax payback of 2.4 years.
- LOM capex of $1.2 billion, including $422.7 million of growth capex and $166.5 million in sustaining capex; and
- Closure costs of $149.8 million.
1 AgEq is calculated using: AgEq Oz = Ag Oz + Au Oz x (Au Price/Ag Price) + Zn lbs x (Zn Price/Ag Price) + Pb lbs x (Pb Price/Ag Price)
Carangas Open Pit Mining – Key Economic Assumptions and Results
| Item | Unit | Value |
|---|---|---|
| Silver Price | $/oz | 45.00 |
| Gold Price | $/oz | 3,400 |
| Zinc Price | $/lb | 1.20 |
| Lead Price | $/lb | 0.90 |
| Total Mill Feed | Mt | 251.5 |
| Open Pit Strip Ratio1 | t:t | 1.4 |
| Annual Processing Rate | Mtpa | 8.0 – 16.0 |
| Average Silver Grade2 | g/t | 36.2 |
| Average Silver Head Grade in “pre-gold production period” | g/t | 54.7 |
| Average Gold Grade in “gold production period” | g/t | 0.74 |
| Silver Recovery to Silver/Lead Concentrate | % | 79.4 |
| Lead Recovery to Silver/Lead Concentrate | % | 71.5 |
| Silver Recovery to Zinc Concentrate | % | 4.5 |
| Zinc Recovery to Zinc Concentrate | % | 62.1 |
| Gold Recovery to Gold/Silver Dore | % | 93.0 |
| Silver Recovery to Gold/Silver Dore | % | 60.0 |
| Total Payable Silver | Moz | 195.1 |
| Total Payable Gold | Moz | 1.1 |
| Total Payable Zinc | Mlbs | 1,453 |
| Total Payable Lead | Mlbs | 941 |
| Mine Life3 | Yrs | 19 |
| Average Annual Payable Silver Metal over LOM | Moz | 10.6 |
| Annual Payable Silver Metal in “pre-gold production period” | Moz | 15.5 |
| Annual Payable Gold Metal in “gold production period” | koz | 142.7 |
| Total Revenue | $M | 15,254 |
| Total Cash Costs of Silver (net of by-products)4 | $/oz | (1.51) |
| Government Royalties | $/oz | 4.06 |
| AISC (net of by-products)5 | $/oz | 0.11 |
| AISC (silver equivalent) | $/oz | 19.16 |
| AISC (gold equivalent) | $/oz | 1,448 |
| Initial Capital Costs | $M | 644.5 |
| Sustaining Capital Costs6 | $M | 166.5 |
| Payback Period (post-tax)7 | Yrs | 2.4 |
| Cumulative Net Cash Flow (pre-tax) | $M | 7,691 |
| Cumulative Net Cash Flow (post-tax) | $M | 4,813 |
| Post-tax NPV (5%) | $M | 2,653 |
| Post-tax IRR | % | 35.9 |
| Post-tax NPV (5%) to Initial Capex Ratio | $:$ | 4.1 |
- LOM average strip ratio.
- LOM average Silver zone.
- Excludes 2 years pre-production period.
- Includes mining costs, processing costs, tailing costs, general and administrative (“G&A”) costs, royalties and selling costs.
- Includes total operating costs, royalties, sustaining capital costs, and closure costs.
- Excludes mine closure costs of $149.8 M.
- The payback period is measured from the beginning of production after construction is completed.
Carangas Project Economic Sensitivity Analysis for Silver Prices – Post-Tax
Silver Price Sensitivity | |||||
|---|---|---|---|---|---|
| Silver Price (US$/oz) | $22.50 (-50%) | $33.75 (-25%) | $45.00 (Base Case) | $56.25 (+25%) | $67.50 (+50%) |
| Results (post-tax NPV $M / IRR) | 973/16.3% | 1,814/26.3% | 2,653/35.9% | 3,461/44.4% | 4,163/51.5% |
Note: Inputs for the base case (100%) are listed in Table 1. Table 2 presents how the Project’s post-tax NPV and IRR are affected by varying the selling price of silver. For example, if the silver price increases by $11.25/oz (from $45.00 to $56.25/oz) while other Inputs remain as the “Base Case”, then the NPV becomes $3,461 M and the IRR is 44.4%. NPV values are discounted at a rate of 5%. Gold, zinc and lead prices are kept constant at $3,400/oz, $1.20/lb and $0.90/lb respectively.
Carangas Project Economic Sensitivity Analysis for Gold Prices – Post-Tax
| Gold Price Sensitivity | |||||
|---|---|---|---|---|---|
| Gold Price (US$/oz) | $1,700 (-50%) | $2,550 (-25%) | $3,400 (Base Case) | $4,250 (+25%) | $5,100 (+50%) |
| Results (post-tax NPV $M / IRR) | 2,042/34.7% | 2,347/35.3% | 2,653/35.9% | 2,959/36.5% | 3,230/37.0% |
Note: Inputs for the base case (100%) are listed in Table 1. Table 3 presents how the Project’s post-tax NPV and IRR are affected by varying the selling price of gold. For example, if the gold price increases by $850/oz (from $3,400 to $4,250/oz) while other Inputs remain as the “Base Case”, then the NPV becomes $2,959 M and the IRR is 36.4%. NPV values are discounted at a rate of 5%. Silver, zinc and lead prices are kept constant at $45,00/oz, $1.20/lb and $0.90/lb respectively.
Total Capital Cost Estimate
| Item | Cost ($M) |
|---|---|
| Mine development1 | 58.7 |
| Processing plant | 202.1 |
| On-Site infrastructure2 | 65.8 |
| Off-Site Infrastructure3 | 114.5 |
| Project Preliminaries (Indirect Costs) | 31.7 |
| Project Delivery (EPCM) | 45.6 |
| Owner’s cost | 15.7 |
| Contingency | 110.3 |
| Initial capital | 644.5 |
| Life of mine growth capital4 | 422.7 |
| Life of mine sustaining capital5 | 166.5 |
| Closure Costs | 149.8 |
Note:
- Includes pre-production capitalized operating costs of $55.3 M.
- Includes earthworks, power switchyard and distribution, fuel storage, sewage, potable water, water management, infrastructure buildings, tailings storage facility, tailings and reclaim pipelines, camp, and site services and mobile equipment.
- Includes access road, water supply, transmission line, and town relocation.
- Expansion capital costs include twinning of the concentrator plant in year 6 and addition of the gold plant in year 9.
- Sustaining capital costs include mining and tailings costs.
Qualified Persons
The qualified persons for the Updated Carangas PEA Technical Report are Mr. Anderson Candido, FAusIMM, Principal Geologist with SLR Mr. Jinxing Ji, P.Eng., Metallurgist with JJ Metallurgical Services, Mr. Kevin Murray, P.Eng., Principle Process Engineer with Ausenco Engineering Canada ULC (“Ausenco”), Mr. Scott Elfen, PE, SME, and Global Technical Lead (Geotechnical) with Ausenco, Mr. James Millard, P.Geo., Director Strategic Projects with Ausenco, and Mr. Marc Schulte, P.Eng., Mining Engineer with Moose Mountain Technical Services. The specific sections for which each qualified person is responsible will be outlined in the Updated Carangas PEA Technical Report. All such qualified persons have reviewed and verified the technical content in this news release relevant to the sections of the Updated Carangas PEA Technical Report for which they are responsible. The qualified persons have verified the information disclosed relative to the sections they have responsibility for in the report.
Further details, including risks and uncertainties will be included in the Updated Carangas PEA Technical Report which will be posted under the Company’s profile at sedarplus.com within 45 days of this news release.
This news release has been reviewed and approved by Alex Zhang, P.Geo., Vice President of Exploration of New Pacific Metals Corp. who is the designated qualified person for the Company.
CAUTIONARY NOTE REGARDING RESULTS OF PRELIMINARY ECONOMIC
ASSESSMENT
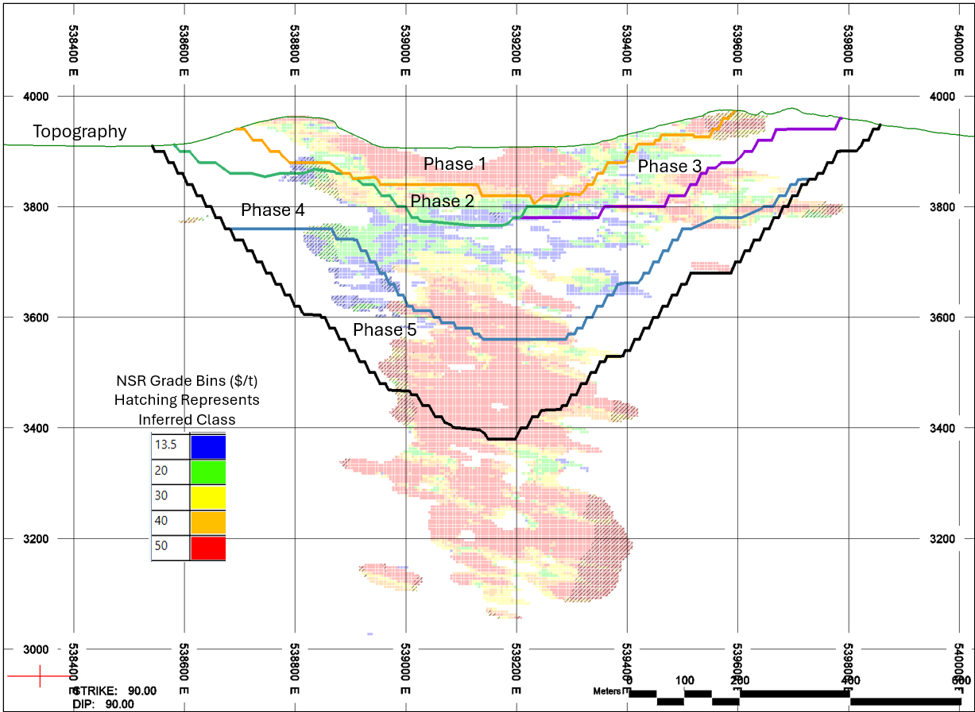
The results of the Preliminary Economic Assessment prepared in accordance with NI 43-101 titled “Carangas Project NI 43-101 Technical Report and Preliminary Economic Assessment” with an anticipated effective date of July 16, 2026 and prepared by certain qualified persons are preliminary in nature and are intended to provide an initial assessment of the Project’s economic potential and development options. The Updated Carangas PEA Technical Report mine schedule and economic assessment includes numerous assumptions and is based on both indicated and Inferred Mineral Resources. Inferred resources are considered too speculative geologically to have the economic considerations applied to them that would enable them to be categorized as Mineral Reserves, and there is no certainty that the preliminary economic assessments described herein will be achieved or that the Updated Carangas PEA Technical Report results will be realized. The estimate of Mineral Resources may be materially affected by geology, environmental, permitting, legal, title, socio-political, marketing or other relevant issues. Bolivia has recently experienced significant social unrest, including protests and blockades that led to a government-declared state of emergency. The Company’s projects have also previously been affected by illegal artisanal and small-scale mining activity, which resulted in disruption to operations. Such political and social instability could adversely affect the assumptions underlying the Updated Carangas PEA Technical Report, including anticipated permitting timelines, construction schedules, and operating costs. Mineral resources are not Mineral Reserves and do not have demonstrated economic viability. Additional exploration will be required to potentially upgrade the classification of the Inferred Mineral Resources to be considered in future advanced studies. Concessions within a small portion of the southern limit of the designed pit containing approximately 1.85% of the mineral resource of the Project are currently not available for tenure and are held by the State of Bolivia. The Company is actively working with the Bolivia government to obtain these concessions. The Company does not consider this to be material to the economics of the Project. Ausenco Engineering Canada ULC (“Ausenco”) (Processing Plant, Infrastructure, Tailings, Water Management, Environment, Cost Estimate) was contracted to lead the PEA in cooperation with SLR Canada (minerals resources), Moose Mountain Technical Services (mining), and JJ Metallurgical Services (Metallurgy). The qualified persons for the Updated Carangas PEA Technical Report are Mr. Anderson Candido, FAusIMM, Principal Geologist with SLR Mr. Jinxing Ji, P.Eng., Metallurgist with JJ Metallurgical Services, Mr. Kevin Murray, P.Eng., Principle Process Engineer with Ausenco, Mr. Scott Elfen, PE, SME, and Global Technical Lead (Geotechnical) with Ausenco, Mr. James Millard, P. Geo., Director, Strategic Projects with Ausenco, and Mr. Marc Schulte, P.Eng., Mining Engineer with Moose Mountain Technical Services. All qualified persons for the Updated Carangas PEA Technical Report have reviewed and verified the disclosure of the Updated Carangas PEA Technical Report herein. The mineral resource estimate contained in the Updated Carangas PEA Technical Report is based on the MRE with an effective date of August 25, 2023, with a re-statement on March 31, 2026. Mineral Resources are constrained by an optimized pit shell at a metal price of $41.00/oz Ag, $3,300.00/oz Au, $1.00/lb Pb, $1.30/lb Zn, $4.00/lb Cu, recovery of 81.6% Ag, 93.4% Au, 73.4% Pb, 66.9% Zn, 38.7% Cu and Cut-off grade of 30 g/t AgEq. Assumptions made to derive a cut-off grade included mining costs, processing costs, and recoveries were obtained from comparable industry situations.
A Globally Significant Silver-Gold Polymetallic Discovery
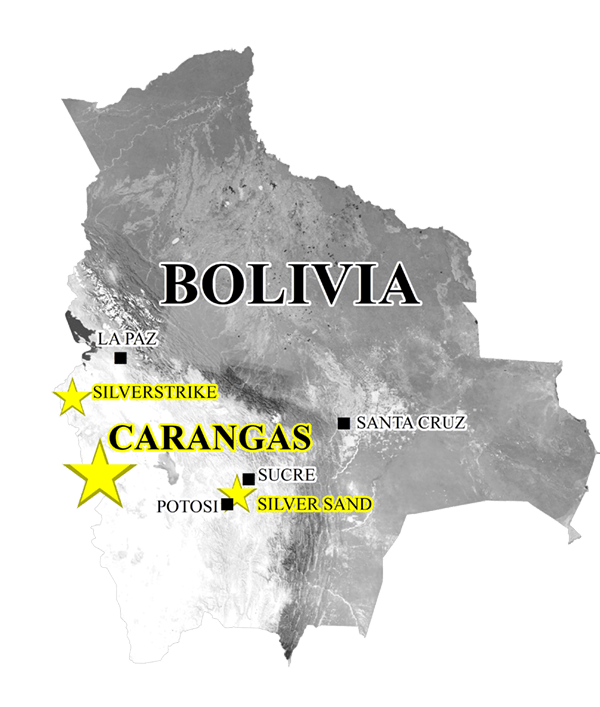
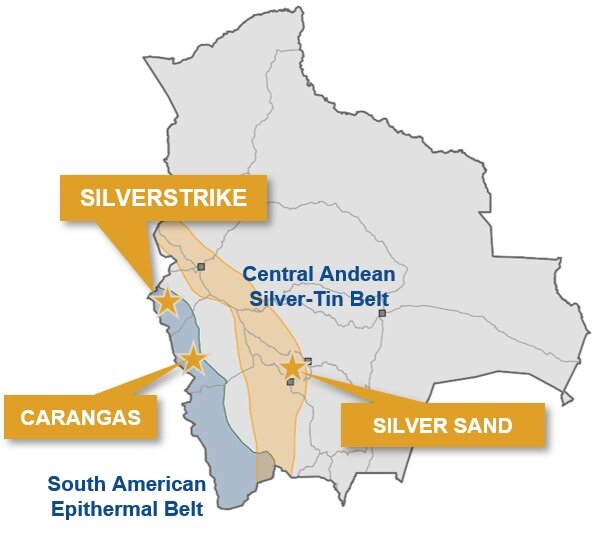
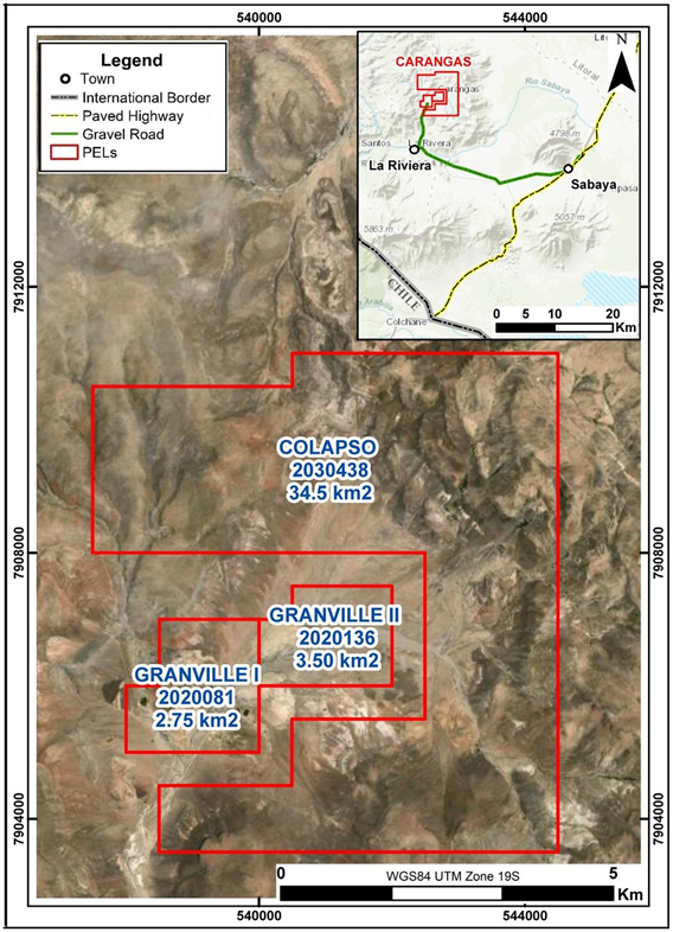
The Carangas Project is located about 190 km southwest of Oruro, Bolivia, within the South American Epithermal Belt, which hosts large precious metal deposits and operations in neighbouring countries but remains under-explored in Bolivia. The property comprises three Exploration Licenses (Granville I, Granville II and Colapso) spanning a total area of 40.75 square kilometers, and is road accessible.
In April 2021, the Company announced that it had entered into a Mining Associate Contract with a private Bolivian corporation. Under the Contract, the Company will cover 100% of future expenditures for exploration, mining, development, and production activities and will receive 98% of operational profits once Carangas moves to the mining production stage. The agreement has a term of 30 years and is renewable for another 15 years.
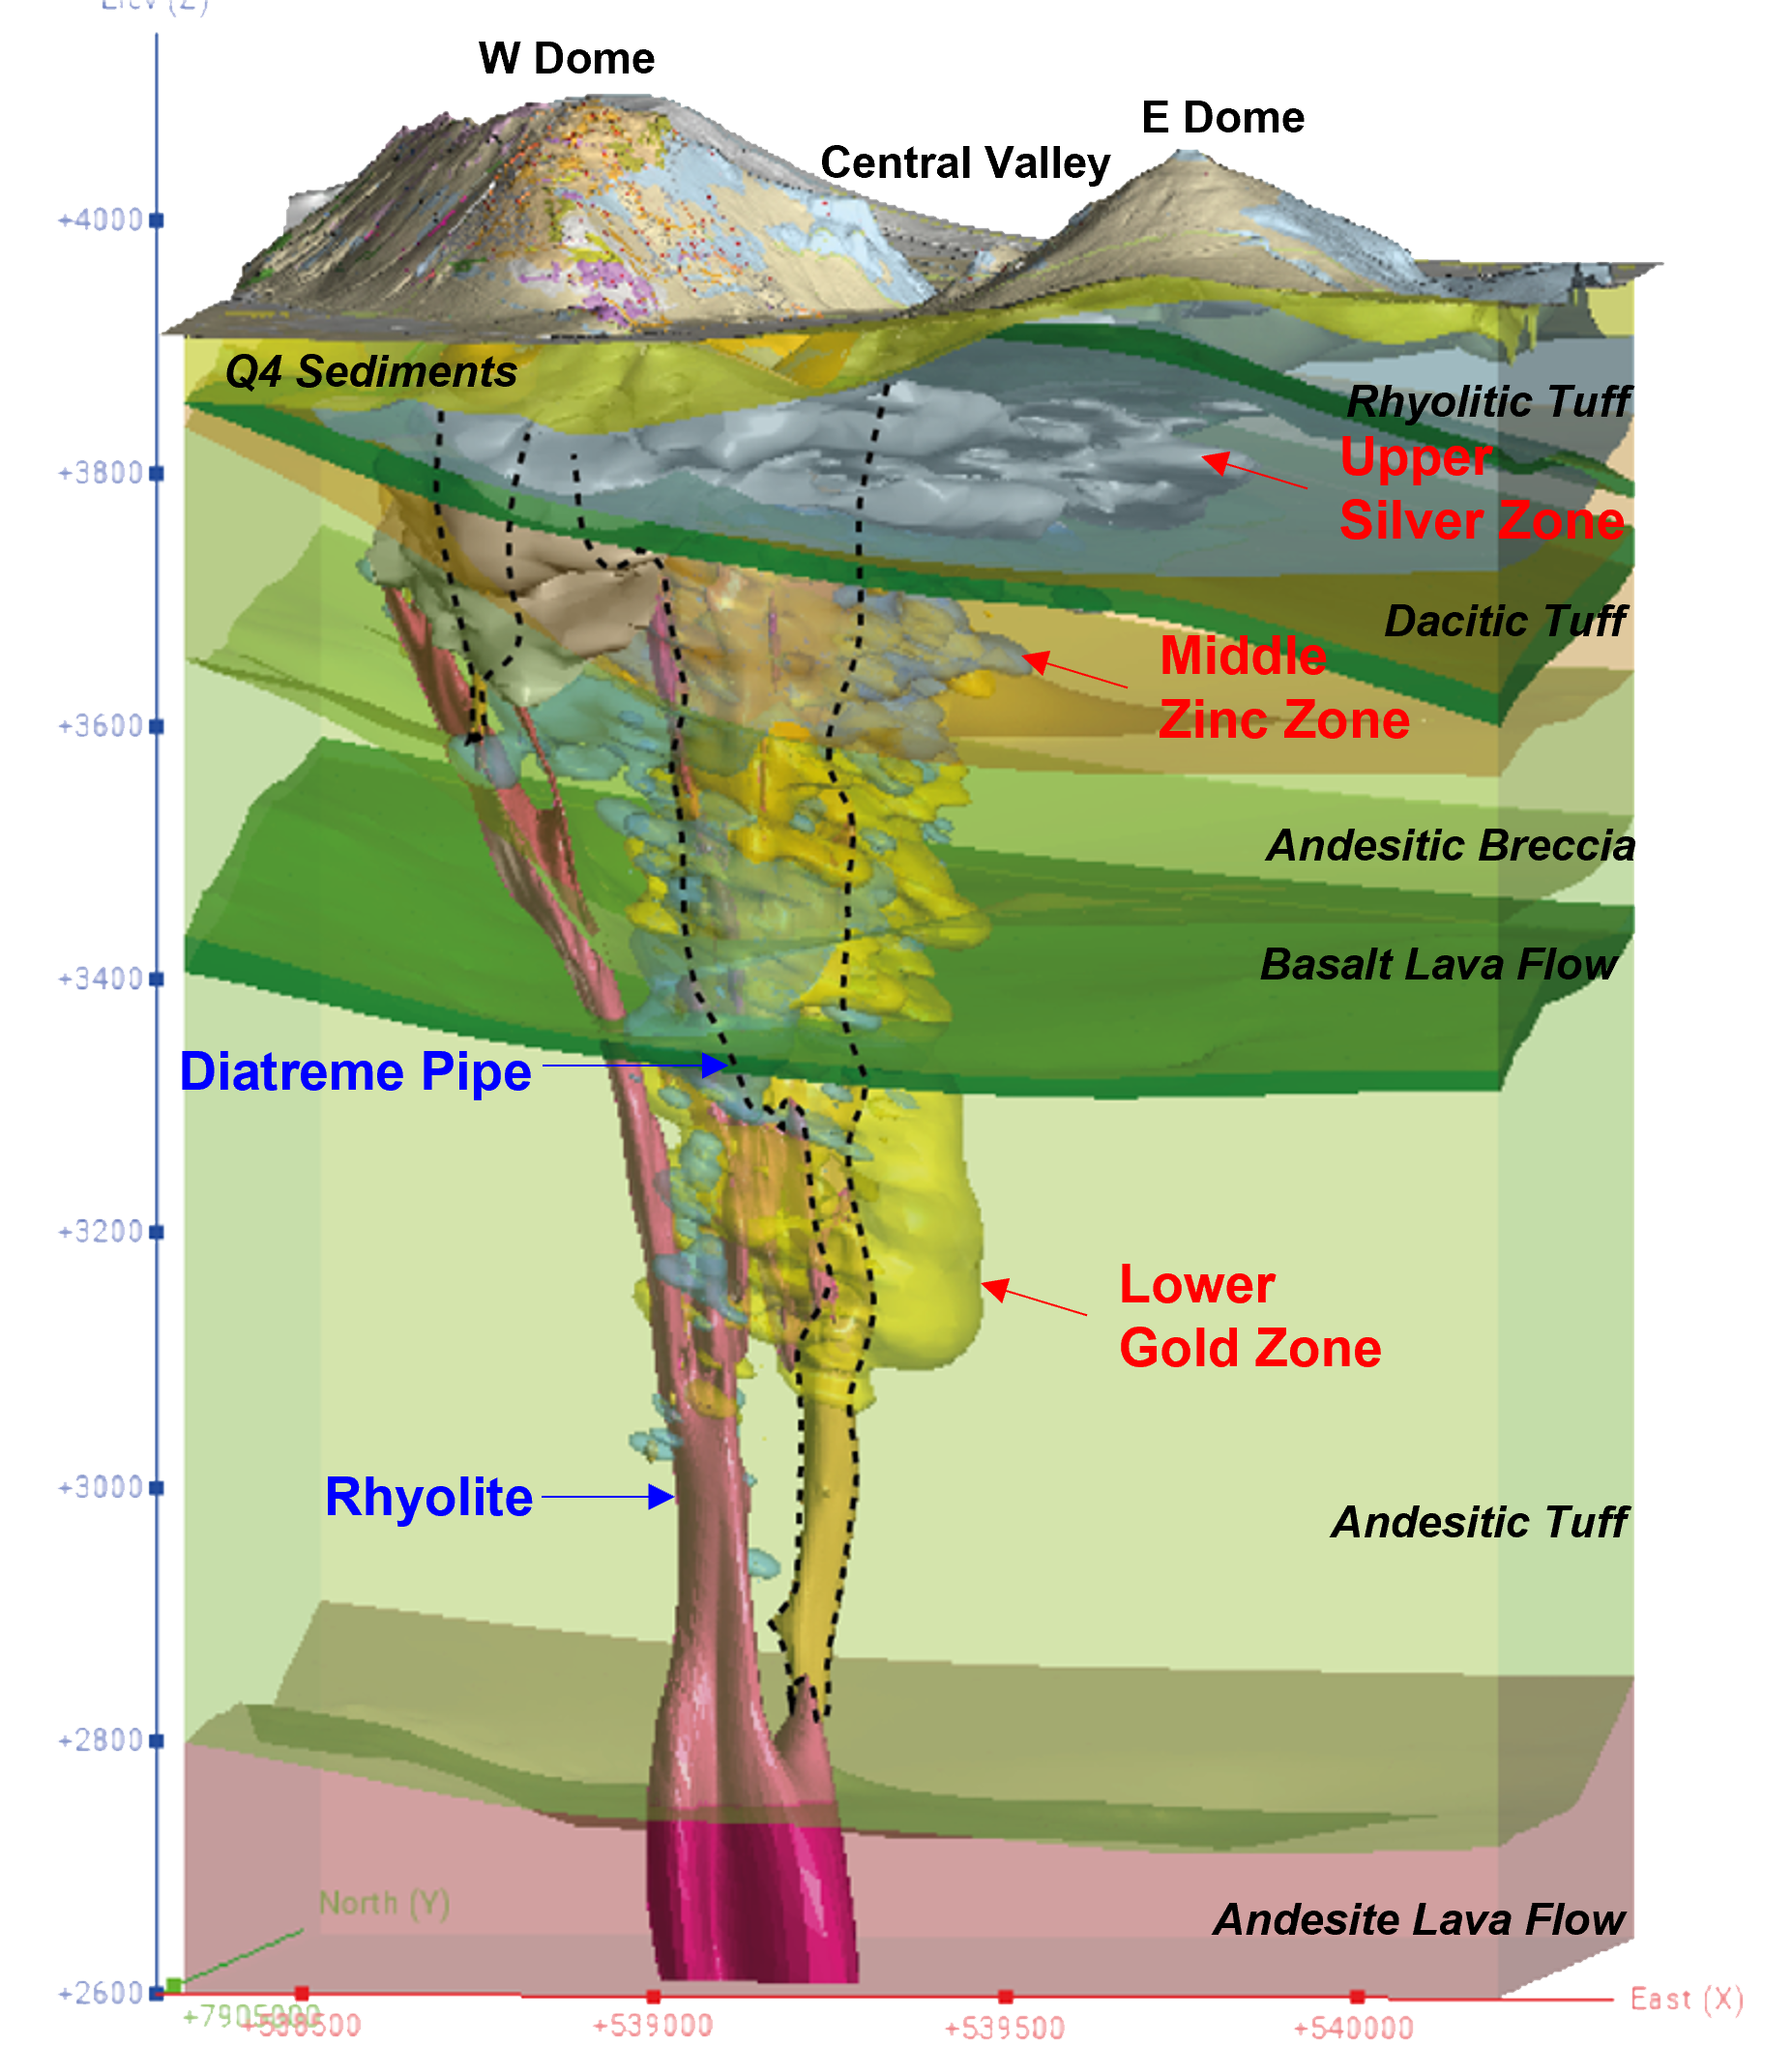
The Carangas Project is hosted within a volcanic caldera system. This system is centered around a Tertiary-aged diatreme. The mineralization process was influenced by the heat gradient from rhyolitic intrusions within the diatreme. This process resulted in the formation of three distinct zones: an upper zone rich in silver, a middle zone dominated by zinc and lead, and a lower zone with a higher concentration of gold. Exploration commenced mid-2021, and over 81,000 m of drilling in 189 drill holes have been completed.
Historical Exploration and Mining
Mining in the district is thought to have commenced in the sixteenth century and continued intermittently until the early twentieth century. The Project, particularly West Dome, contains extensive surface workings, underground mine adits, shafts and associated processing and smelting infrastructure. There is no active mining at present.
Modern mineral exploration, led by local mining interests, began in the early 1980s. The first drill program, comprising nine reverse circulation holes for a total of 1,000 m, was carried out in 1995. Written records for the program report a drill intercept of 116 m at an average grade of 95 g/t silver (from 18 m to 134 m downhole), including 16 m at 325 g/t silver (from 66 m to 82 m downhole), including a 4-m mined-out interval in hole RC-05.
A second drill program was conducted in 2000, also led by a local Bolivian group, with six diamond drill holes for a total of 914 m completed. The results are in line with prior exploration and include a drill intercept of 76 m at an average grade of 90 g/t silver, 0.96% lead, and 0.12% zinc (from 0 m to 76 m downhole), including 8 m at 266 g/t silver, 1.02% lead, and 0.06% zinc (from 26m to 34 m downhole) in hole DDH-01. No recorded exploration activities occurred over the next 20 years until the Company’s involvement.
Geological Overview
The Carangas Project is hosted within a volcanic caldera system. This system is centered around a Tertiary-aged diatreme. The mineralization process was influenced by the heat gradient from rhyolitic intrusions within the diatreme. This process resulted in the formation of three distinct zones: an upper zone rich in silver, a middle zone dominated by zinc and lead, and a lower zone with a higher concentration of gold.
Exploration Highlights
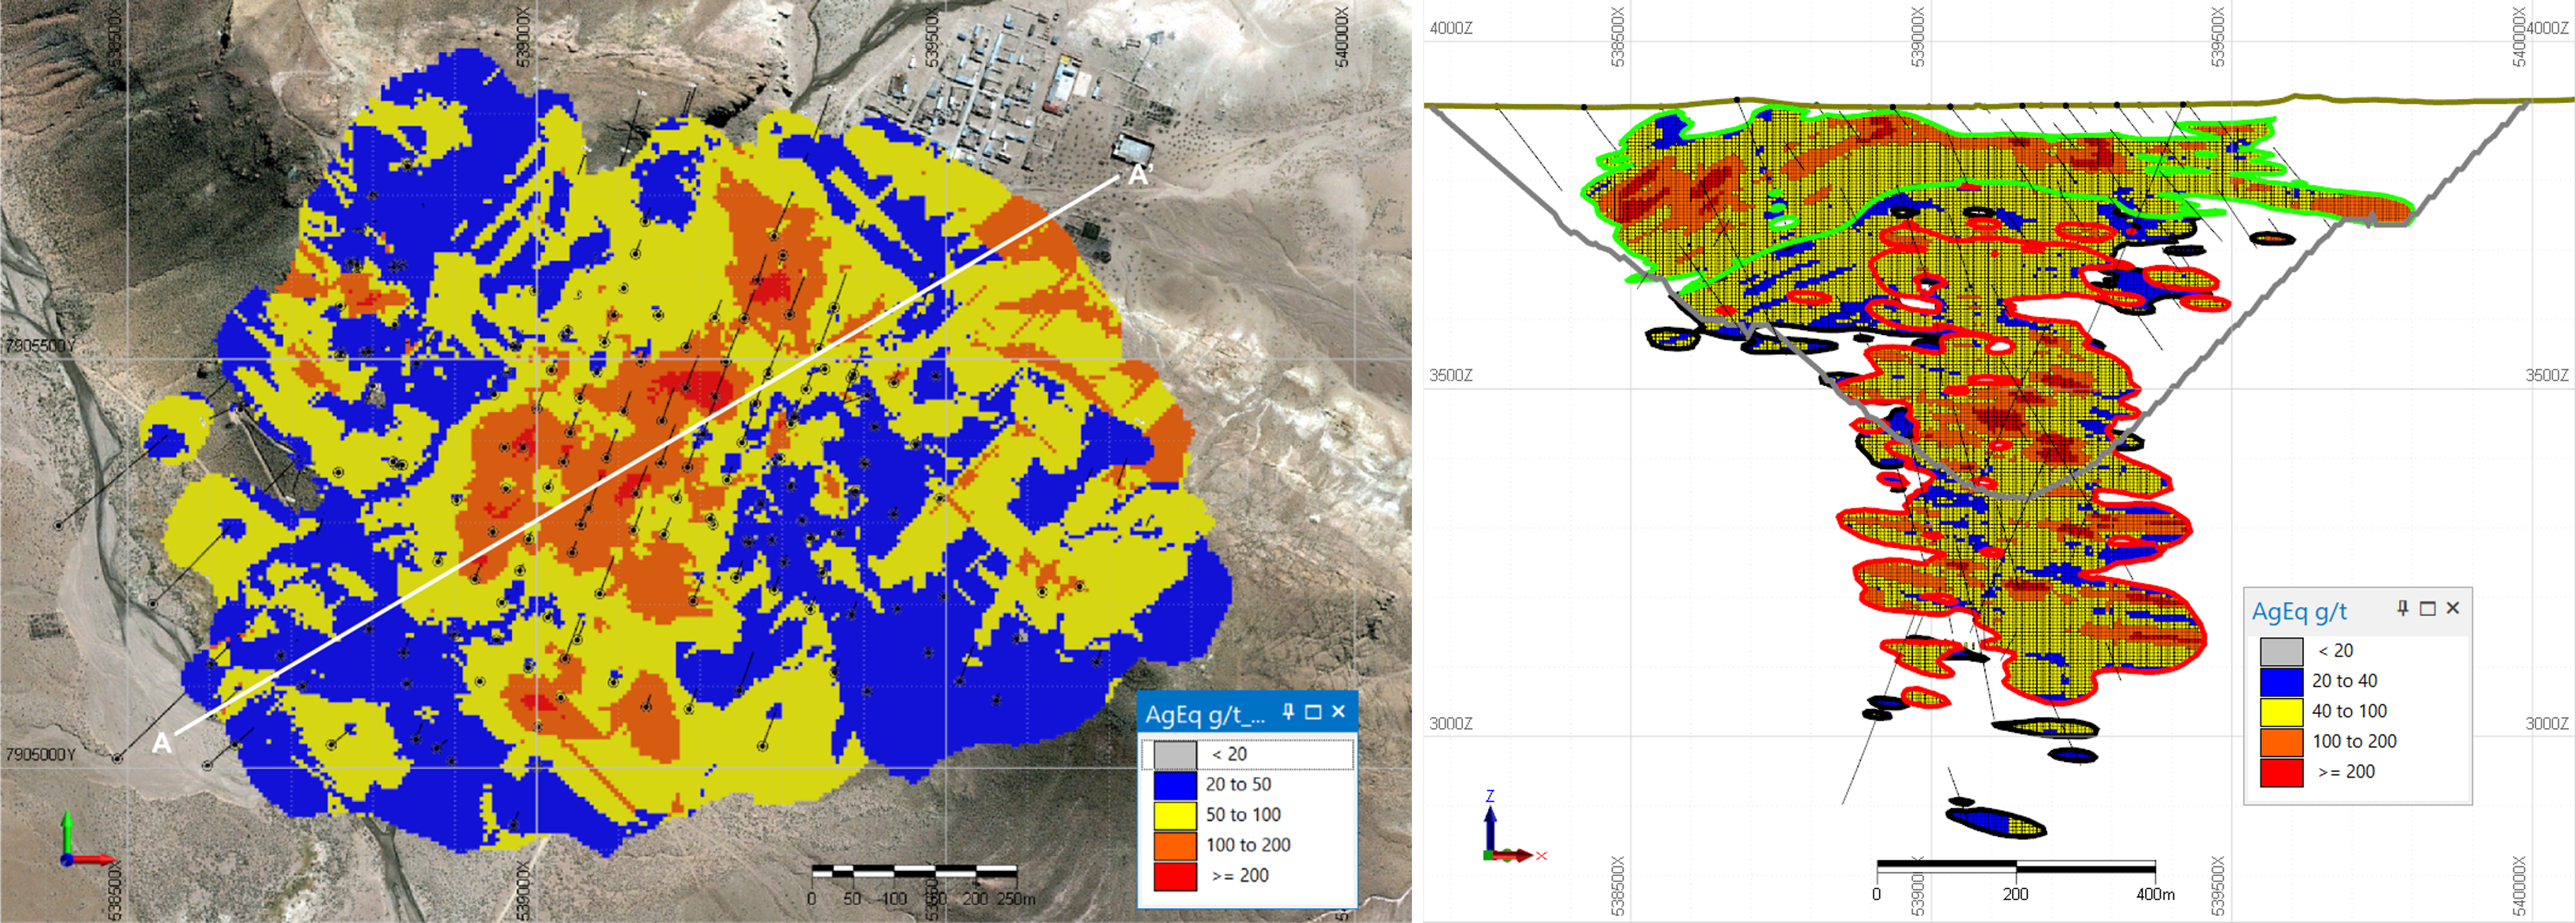
Below the 2023 Mineral Resource Estimate conceptual pit constraint exists gold-dominated mineralized material of similar size and grade to the reported mineral resources of the Lower Gold Zone. This mineralized material has the potential to be converted to mineral resources amendable to underground mining pending further evaluation for reasonable prospects of eventual economic extraction. Gold mineralization remains open to the north and northeast at depth.
Regional Exploration Potential
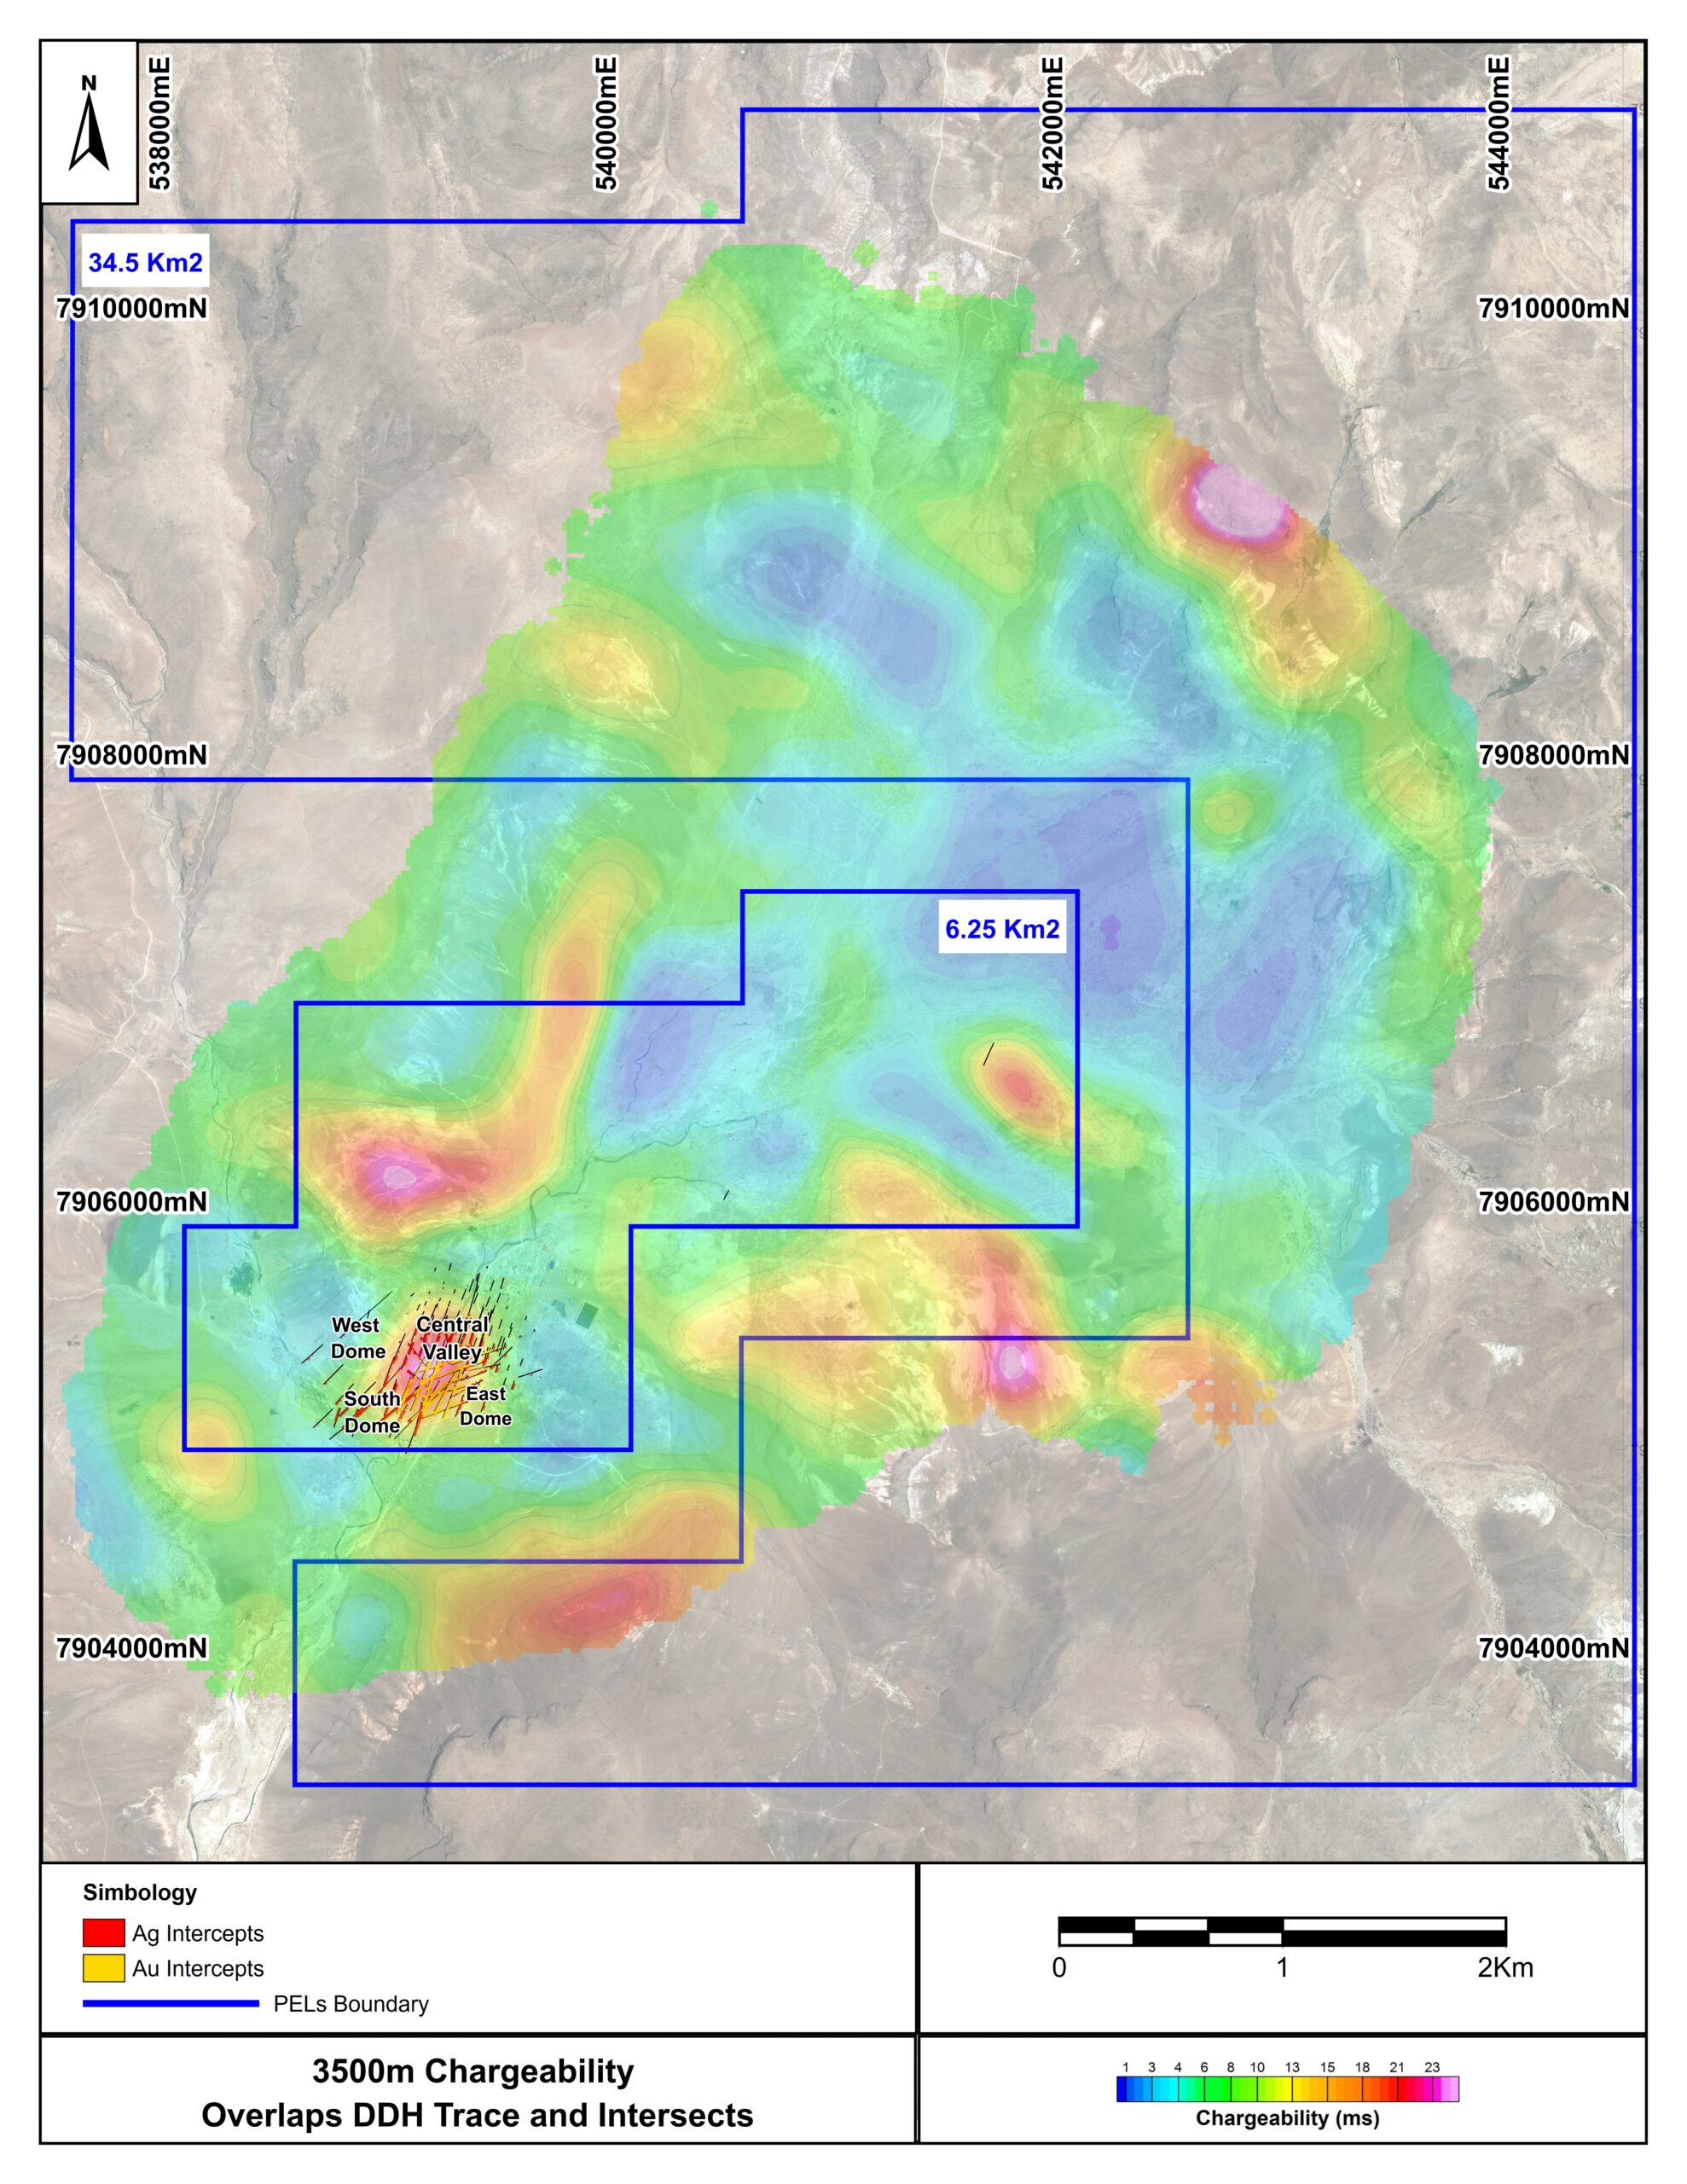
The Company also completed a 3D Bipole-Dipole IP-MT survey in an area of approximately 29 square kilometers over the entire Carangas caldera basin in early 2023. This survey demonstrated that the known gold mineralization system overlays a strong chargeability anomaly in the Central Valley area. In addition, multiple strong IP chargeability anomalies were identified beyond the drilled areas. The Company believes that these anomalies may host mineralization similar to what has been drilled thus far, underscoring the potential for mineral resource growth through additional drilling campaigns.
Metallurgical Testing
Preliminary metallurgical testwork consists of scoping-level cyanide leach and flotation testing and is carried out by Bureau Veritas’s Metallurgical Division in Richmond, British Columbia, Canada. Mineralized materials sampled from rejects of selected Carangas drill cores with assays were composited to five samples based on the type of mineralization and degree of oxidization. Host rock sample is altered volcanoclastic rocks of dacitic-rhyolitic composition.
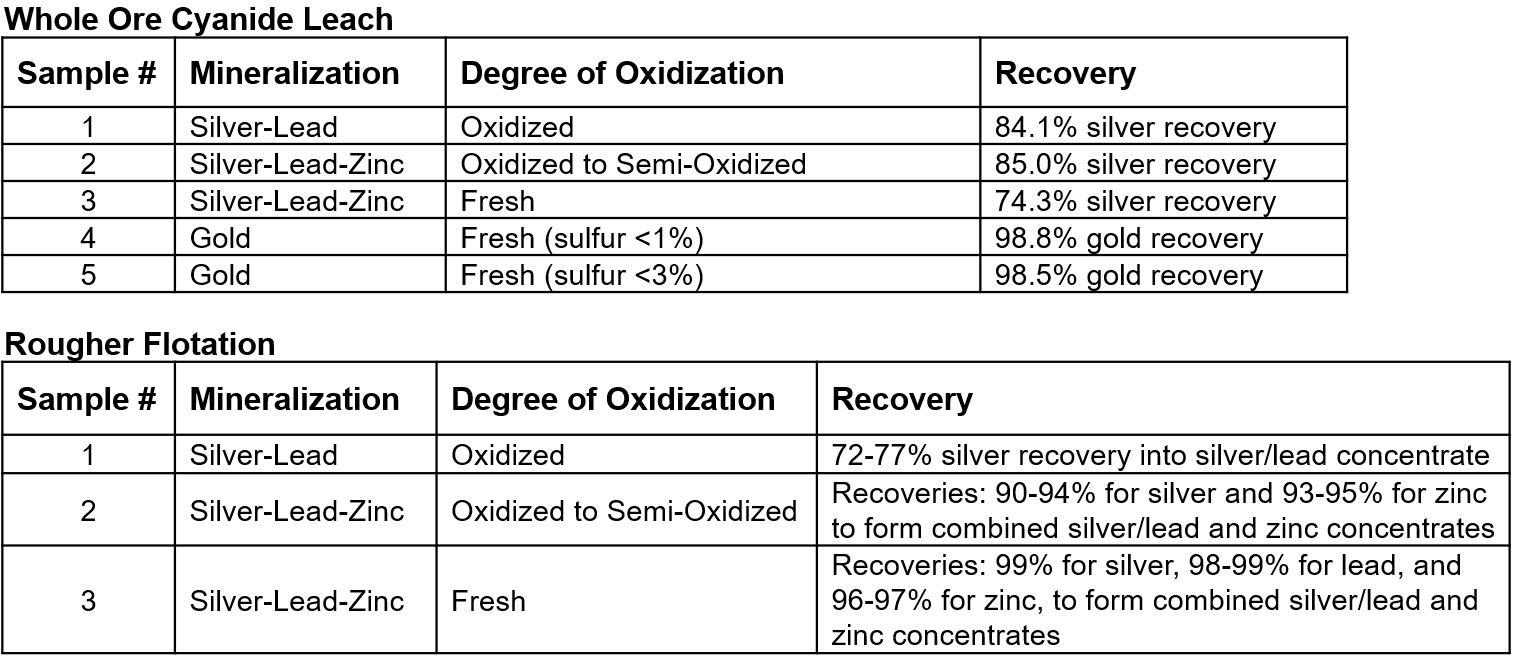
These preliminary test results clearly demonstrate that high recovery rates can be expected for gold using cyanide leaching and for silver, lead, and zinc through conventional cyanide leaching and flotation for silver-lead-zinc mineralized materials. Based on the preliminary metallurgical test results, the following recommendations can be made with respect to the selection of flowsheet for the future process plan:
For gold, cyanide leach and carbon-in-pulp (CIP) may potentially achieve an average of 98.6% gold recovery. Gold doré will be the final product.
For silver-lead-zinc, silver/lead concentrate and zinc concentrate may be produced by sequential selective flotation or gravity concentration. The resultant silver/lead concentrate may be treated by cyanide leach to enable silver doré production.
Mineral Resource Estimate
The Mineral Resource Estimate (“MRE”), constrained by a conceptual open pit shell for reporting purposes, is reported using a cut off grade of 30 g/t AgEq and is presented in Table 6 with an effective date of March 31, 2026.
| Domain | Category | Tonnage | AgEq | Ag | Au | Pb | Zn | |||||
|---|---|---|---|---|---|---|---|---|---|---|---|---|
| Mt | g/t | Mozs | g/t | Mozs | g/t | Kozs | % | Mlbs | % | Mlbs | ||
| Upper Silver Zone | Indicated | 121.6 | 70 | 272.4 | 44 | 173.9 | 0.06 | 220.0 | 0.34 | 923.3 | 0.65 | 1,729.6 |
| Inferred | 33.6 | 67 | 72.9 | 42 | 45.9 | 0.11 | 119.6 | 0.29 | 211.6 | 0.48 | 357.6 | |
| Middle Zinc Zone | Indicated | 38.7 | 41 | 51.3 | 12 | 15.1 | 0.06 | 68.8 | 0.37 | 314.1 | 0.81 | 688.0 |
| Inferred | 9.1 | 39 | 11.5 | 9 | 2.6 | 0.05 | 15.3 | 0.38 | 77.1 | 0.85 | 172.2 | |
| Lower Gold Zone | Indicated | 78.4 | 82 | 205.9 | 10 | 24.4 | 0.76 | 1,911.7 | 0.12 | 215.0 | 0.23 | 403.8 |
| Inferred | 11.0 | 80 | 28.3 | 10 | 3.6 | 0.70 | 248.5 | 0.15 | 36.2 | 0.34 | 82.4 | |
| Total | Indicated | 238.8 | 69 | 529.6 | 28 | 213.4 | 0.29 | 2,200.5 | 0.28 | 1,452.4 | 0.54 | 2,821.3 |
| Inferred | 53.8 | 65 | 112.7 | 30 | 52.1 | 0.22 | 383.4 | 0.27 | 324.9 | 0.52 | 612.3 | |
Notes:
- CIM Definition Standards (2014) were used for reporting the Mineral Resources.
- The qualified person (as defined in NI 43-101) for the purposes of the MRE is Anderson Candido, FAusIMM, Principal Geologist with SLR.
- Mineral Resources are constrained by an optimized pit shell at a metal price of $41.00/oz Ag, $3,300.00/oz Au, $1.00/lb Pb, $1.30/lb Zn, $4.00/lb Cu, recovery of 81.6% Ag, 93.4% Au, 73.4% Pb, 66.9% Zn, 38.7% Cu and Cut-off grade of 30 g/t AgEq.
- AgEq formula is: AgEq g/t = Ag g/t + Au g/t * 80.49 + (Pb %*2204.6 /100 + Zn %*2866 /100 + Cu %* 8818.5 /100) / 1.318
- Drilling results up to June 1, 2023.
- The numbers may not compute exactly due to rounding.
- Mineral Resources are reported on a dry in-situ basis.
- Mineral resources are not Mineral Reserves and have not demonstrated economic viability.
There are certain legal, political, environmental or other risks related to development of the Project. See “Cautionary Note Regarding Results of Preliminary Economic Assessment” and “Cautionary Note Regarding Forward-Looking Information”